Part of series:Visualize
GWFM结果可视化
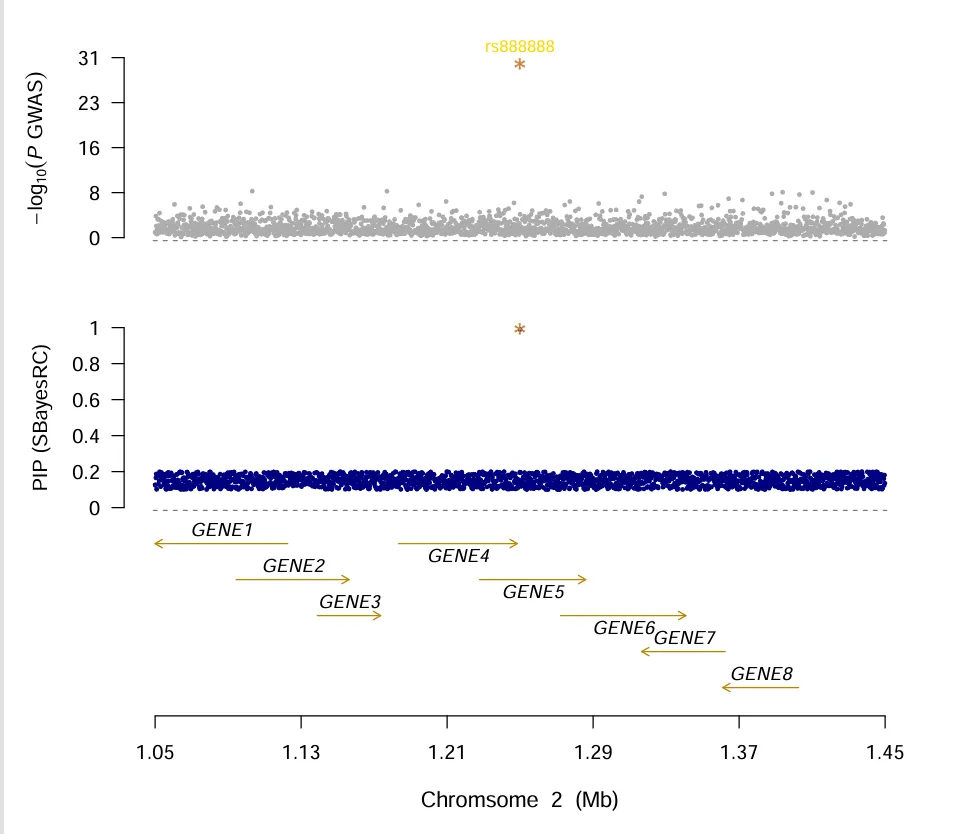
When you want draw locus plot of GWFM, follow scripts will meet your require
plot_GWFM.r
# ===========================================================================================//
# @Author  :    Loren Shi
# @Time    :    2025/06/05 15:42:36
# @File    :    plot_GWFM.r
# @Mails   :    crazzy_rabbit@163.com
# @line    :    https://github.com/Crazzy-Rabbit
#
# R script to draw regional plot for genome wide fine mapping SNPs.
#
# Part of code are adopted from plot_smr script which provided by SMR
#
# Amendment:
#  2025/06/05
#    1. script completed
#    2. first realeased
#    3. fixed teh bug where the drawn gene was not in the middle of the genelayer when nrowgene=1
#
# Usages:
#     source("plot_GWFM.r")
#     PData <- ReadPvalueFromFiles(gwas="gwas_chrpos.gz", gwfm="gwaf.snpRes", glist="glist_hg19_refseq.txt", windowsize=200000, highlight="rs641221")
#     pdf('gwfm_plot.pdf',width = 8,height = 8)
#     MultiPvalueLocusPlot(data=PData)
#     dev.off()
# ===========================================================================================//
is.installed <- function(mypkg){
    is.element(mypkg, installed.packages()[,1])
}
# check if package "TeachingDemos" is installed
if (!is.installed("TeachingDemos")){
    install.packages("TeachingDemos");
}
library(TeachingDemos)
library(data.table)

# parmeters for plot
genemove=0.01; txt=1.1; cex=1.3; lab=1.1; axis=1; top_cex=1.2;

GeneRowNum = function(GENELIST) {
    BP_THRESH = 0.03; MAX_ROW = 5
    # get the start and end position
    GENELIST = GENELIST[!duplicated(GENELIST$GENE),]
    START1 = as.numeric(GENELIST$GENESTART);
    END1 = as.numeric(GENELIST$GENEEND)
    STRLENGTH = nchar(as.character(GENELIST$GENE))
    MIDPOINT = (START1 + END1)/2
    START2 = MIDPOINT-STRLENGTH/250;
    END2 = MIDPOINT+STRLENGTH/250
    START = cbind(START1, START2);
    END = cbind(END1, END2);
    START = apply(START, 1, min);
    END = apply(END, 1, max)
    GENELIST = data.frame(GENELIST, START, END)
    GENELIST = GENELIST[order(as.numeric(GENELIST$END)),]
    START = as.numeric(GENELIST$START); END = as.numeric(GENELIST$END)
    # get the row index for each gene
    NBUF = dim(GENELIST)[1]
    ROWINDX = rep(1, NBUF)
    ROWEND = as.numeric(rep(0, MAX_ROW))
    MOVEFLAG = as.numeric(rep(0, NBUF))
    if(NBUF>1) {
        for( k in 2 : NBUF ) {
            ITERFLAG=FALSE
            if(START[k] < END[k-1]) {
                INDXBUF=ROWINDX[k-1]+1
            } else INDXBUF = 1
            if(INDXBUF>MAX_ROW) INDXBUF=1;
            REPTIME=0
            repeat{
                if( ROWEND[INDXBUF] > START[k] ) {
                    ITERFLAG=FALSE
                    INDXBUF=INDXBUF+1
                    if(INDXBUF>MAX_ROW) INDXBUF = 1
                } else {
                    ITERFLAG=TRUE
                }
                if(ITERFLAG) break;
                REPTIME = REPTIME+1
                if(REPTIME==MAX_ROW) break;
            }
            ROWINDX[k]=INDXBUF;

            if( (abs(ROWEND[ROWINDX[k]]-START[k]) < BP_THRESH)
            | ((ROWEND[ROWINDX[k]]-START[k])>0) ) {
                MOVEFLAG[k] = 1
                SNBUF = tail(which(ROWINDX[c(1:k)]==ROWINDX[k]), n=2)[1]
                MOVEFLAG[SNBUF] = MOVEFLAG[SNBUF] - 1
            }
            if(ROWEND[ROWINDX[k]]<END[k]) {
                ROWEND[ROWINDX[k]] = END[k]  }
        }
    }
    GENEROW = data.frame(as.character(GENELIST$GENE),
    as.character(GENELIST$ORIENTATION),
    as.numeric(GENELIST$GENESTART),
    as.numeric(GENELIST$GENEEND),
    ROWINDX, MOVEFLAG)
    colnames(GENEROW) = c("GENE", "ORIENTATION", "START", "END", "ROW", "MOVEFLAG")
    return(GENEROW)
}

ReadPvalueFromFiles <- function(gwas, gwfm, glist, windowsize=500000, highlight) {
    gwas1 = fread(gwas)[, .(CHR, POS, SNP, p)]
    colnames(gwas1) = c("CHR", "BP", "SNP", "p")
    gwas1$CHR = as.character(gwas1$CHR)
    gwas2 = fread(gwfm)[, .(Chrom, Position, Name, PIP)]
    colnames(gwas2) = c("CHR", "BP", "SNP", "p")
    gwas2$CHR = as.character(gwas2$CHR)

    snp_gwas1 = gwas1[gwas1$SNP == highlight, ];
    chrom = unique(snp_gwas1$CHR)
    if (nrow(snp_gwas1) == 0) {stop("highlight SNP not found in file1, please check it!")}
    BP1 = snp_gwas1$BP
    start1 = BP1 - windowsize;
    end1 = BP1 + windowsize;
    file1 = gwas1[gwas1$CHR == chrom & gwas1$BP > start1 & gwas1$BP < end1, ]

    snp_gwas2 = gwas2[gwas2$SNP == highlight, ];
    if (nrow(snp_gwas2) == 0) {stop("highlight SNP not found in file2, please check it!")}
    BP2 = snp_gwas2$BP
    start2 = BP2 - windowsize;
    end2 = BP2 + windowsize;
    file2 = gwas2[gwas2$CHR == chrom & gwas2$BP > start2 & gwas2$BP < end2, ]

    start = max(c(start1, start2), na.rm=T) / 1e6;
    end = max(c(end1, end2), na.rm=T) / 1e6;
    glist = fread(glist)
    glist[,2] = glist[,2]/1e6;
    glist[,3] = glist[,3]/1e6;
    colnames(glist) = c("CHR", "GENESTART",  "GENEEND",  "GENE", "ORIENTATION")
    glist = glist[glist$CHR == chrom & glist$GENESTART >= start & glist$GENEEND <= end, ]

    return_lsit = list(file1=file1, file2=file2, SNP=highlight, glist=glist, CHR=chrom)
}


MultiPvalueLocusPlot <- function(data) {
    gwas1 = data$file1;
    gwas2 = data$file2;

    pXY1 = -log10(gwas1$p);
    yMAX = ceiling(max(pXY1, na.rm=T)) + 1;

    pXY2 = gwas2$p;
    yMAX2 = ceiling(max(pXY2, 1, na.rm=T));

    glist = data$glist;
    generow = GeneRowNum(glist);
    num_row = max(as.numeric(generow$ROW));
    offset_map = ceiling(yMAX);
    offset_map = max(offset_map, num_row*2.5);
    offset_pip = yMAX / 2.5;
    dev_axis = 0.1*yMAX;
    if (dev_axis < 1.5) dev_axie=1.5;
    yaxis.min = -offset_map - offset_pip - dev_axis - yMAX;
    yaxis.max = yMAX + ceiling(offset_pip) + 1;
    gwasBP1 = as.numeric(gwas1$BP) / 1e6;
    gwasBP2 = as.numeric(gwas2$BP) / 1e6;
    xmin = min(c(gwasBP1, gwasBP2), na.rm=T) - 0.001;
    xmax = max(c(gwasBP1, gwasBP2), na.rm=T) + 0.001;


    xlab = paste("Chromsome ", data$CHR, " (Mb)")
    #------------------- plot gwas layer ----//
    ylab1 = expression(-log[10] (italic(P) * " GWAS"))
    par(mar=c(5,5,3,2), xpd=TRUE);
    plot(gwasBP1, pXY1, pch=20, xaxt="n", yaxt="n", bty="n", ylim=c(yaxis.min, yaxis.max),
    xlim=c(xmin, xmax), xlab=xlab, ylab="", cex.lab=lab, cex.axis=axis,cex=0.6, col="gray68");
    devbuf1 = yMAX/4;
    xticks = round(seq(xmin, xmax, length.out=6), 2);
    axis(1, at=xticks, lwd=1);
    axis(2, at=seq(0, yMAX, by=devbuf1), labels=round(seq(0, yMAX, devbuf1), 0), las=1, lwd=1);
    mtext(ylab1, side=2, line=3, at=(yMAX*1/2));
    segments(x0=xmin, y0=-0.5, x1=xmax, y1=-0.5, col="grey50", lwd=1, lty=2);

    snp1 = gwas1[SNP == data$SNP, ]
    snpBP1 = snp1$BP / 1e6;
    snpP1 = -log10(snp1$p);

    points(snpBP1, snpP1, pch="*", col="peru", cex=2);
    text(snpBP1, snpP1, labels=snp1$SNP, col="gold", pos=3, cex=0.8, offset=0.5);

    #------------------- plot PIP layer ----//
    ylab2 = "PIP (SBayesRC)"
    axis.start = 0;
    axis.start = axis.start - yMAX - offset_pip - dev_axis;
    pXY2buf = pXY2 / yMAX2*yMAX + axis.start;
    par(new=TRUE);
    plot(gwasBP2, pXY2buf, pch=20, xaxt="n", yaxt="n", bty="n", ylim=c(yaxis.min, yaxis.max),
    xlim=c(xmin, xmax), ylab="", xlab="", cex.lab=lab, cex.axis=axis, cex=0.6, col="navy");
    devbuf2 = yMAX2/5;
    axis(2, at=seq(axis.start, (axis.start+yMAX), yMAX/5), labels=seq(0, yMAX2, devbuf2), las=1, lwd=1);
    mtext(ylab2, side=2, line=3, at=((axis.start + axis.start + yMAX)/2));
    segments(x0=xmin, y0=axis.start-0.5, x1=xmax, y1=axis.start-0.5, col="grey50", lwd=1, lty=2);

    snp2 = gwas2[SNP == data$SNP, ]
    snpBP2 = snp2$BP / 1e6;
    snpP2 = snp2$p / yMAX2*yMAX + axis.start;

    points(snpBP2, snpP2, pch="*", col="peru", cex=2);
    #------------------- plot gene layer ----//
    num_gene = dim(generow)[1]
    dist = offset_map / num_row;
    for (k in 1:num_row) {
        generowbuf = generow[which(as.numeric(generow[, 5]) == k), ]
        xstart = as.numeric(generowbuf[, 3])
        xend = as.numeric(generowbuf[, 4])
        snbuf = which(xend - xstart < 1e-3)
        if (length(snbuf) > 0) {
            xstart[snbuf] = xstart[snbuf] - 0.0025
            xend[snbuf] = xend[snbuf] + 0.0025
        }
        xcenter = (xstart+xend)/2
        xcenter = spread.labs(xcenter, mindiff=0.01, maxiter=1000, min=xmin, max=xmax)
        num_genebuf = dim(generowbuf)[1]
        if (num_row == 1) {
            for (l in 1:num_genebuf) {
                ofs=0.3;
                if (l%%2 == 0) ofs=-0.8;
                ypos = offset_map/2 + yaxis.min - 1;
                code = 1;
                if (generowbuf[l,2] == "+") code=2;
                arrows(x0=xstart[l], y0=ypos, x1=xend[l], y1=ypos, code=code, length=0.07, ylim=c(yaxis.min, yaxis.max),
                col=colors()[75], lwd=1)
                movebuf = as.numeric(generowbuf[l, 6]) * genemove
                text(x=xcenter[l]+movebuf, y=ypos, label=substitute(italic(genename), list(genename=as.character(generowbuf[l,1]))), pos=3, offset=ofs, col="black", cex=0.9)
            }
        } else if (num_row > 1) {
            for (l in 1:num_genebuf) {
                ofs=0.3
                if(l%%2==0) ofs=-0.8
                m = num_row - k
                ypos = m*dist + yaxis.min
                code = 1;
                if (generowbuf[l,2] == "+") code = 2;
                arrows(x0=xstart[l], y0=ypos, x1=xend[l], y1=ypos, code=code, length=0.07, ylim=c(yaxis.min, yaxis.max),
                col=colors()[75], lwd=1)
                movebuf = as.numeric(generowbuf[l,6]) * genemove
                text(x=xcenter[l]+movebuf, y=ypos, label=substitute(italic(genename), list(genename=as.character(generowbuf[l,1]))), pos=3, offset=ofs, col="black", cex=0.9)
            }
        }
    }
}
example data
set.seed(123)

n_snps <- 10000
n_genes <- 10

## SNP pos
positions <- as.integer(seq(500000, 2500000, length.out = n_snps))
snp_ids <- paste0("rs", 1000000 + 0:(n_snps - 1))

## highlight SNP(GWAS)
highlight_snp <- data.frame(
  CHR = "2",
  POS = 1250000,
  SNP = "rs888888",
  p = 1e-30
)

## GWAS summary
pvals <- pmax(rbeta(n_snps, 0.4, 5), 1e-8)
gwas_df <- data.frame(
  CHR = rep("2", n_snps),
  POS = positions,
  SNP = snp_ids,
  p = pvals
)

gwas_df <- rbind(gwas_df, highlight_snp)
write.table(gwas_df, file = "sim_gwas_chr2.gz", sep = "\t", row.names = FALSE, quote = FALSE)

## highlight SNP(PIP)
highlight_pip <- data.frame(
  Chrom = "2",
  Position = 1250000,
  Name = "rs888888",
  PIP = 0.99
)

# PIP data, finemapping result
pip_values <- round(runif(n_snps, 0.1, 0.2), 4)
gwfm_df <- data.frame(
  Chrom = rep("2", n_snps),
  Position = positions,
  Name = snp_ids,
  PIP = pip_values
)

gwfm_df <- rbind(gwfm_df, highlight_pip)
write.table(gwfm_df, file = "sim_gwfm.snpRes", sep = "\t", row.names = FALSE, quote = FALSE)

# gene list
gene_starts <- as.integer(seq(1050000, 1450000, length.out = n_genes))
gene_lengths <- sample(30000:80000, n_genes, replace = TRUE)
gene_ends <- gene_starts + gene_lengths

gene_df <- data.frame(
  CHR = rep("2", n_genes),
  GENESTART = gene_starts,
  GENEEND = gene_ends,
  GENE = paste0("GENE", 1:n_genes),
  ORIENTATION = sample(c("+", "-"), n_genes, replace = TRUE)
)

write.table(gene_df, file = "sim_glist_chr2.txt", sep = "\t", row.names = FALSE, quote = FALSE)
run script
source("plot_GWFM.r")
PData <- ReadPvalueFromFiles(gwas="sim_gwas_chr2.gz", gwfm="sim_gwfm.snpRes", glist="sim_glist_chr2.txt", windowsize=200000, highlight="rs888888")
pdf('gwfm_plot.pdf',width = 8,height = 8)
MultiPvalueLocusPlot(data=PData)
dev.off()